
From opinion to evidence: how we built a data-led product framework for news apps at Funke

Audiencers' Festival London FUNKE Media Audiencers' Festival London FUNKE Media
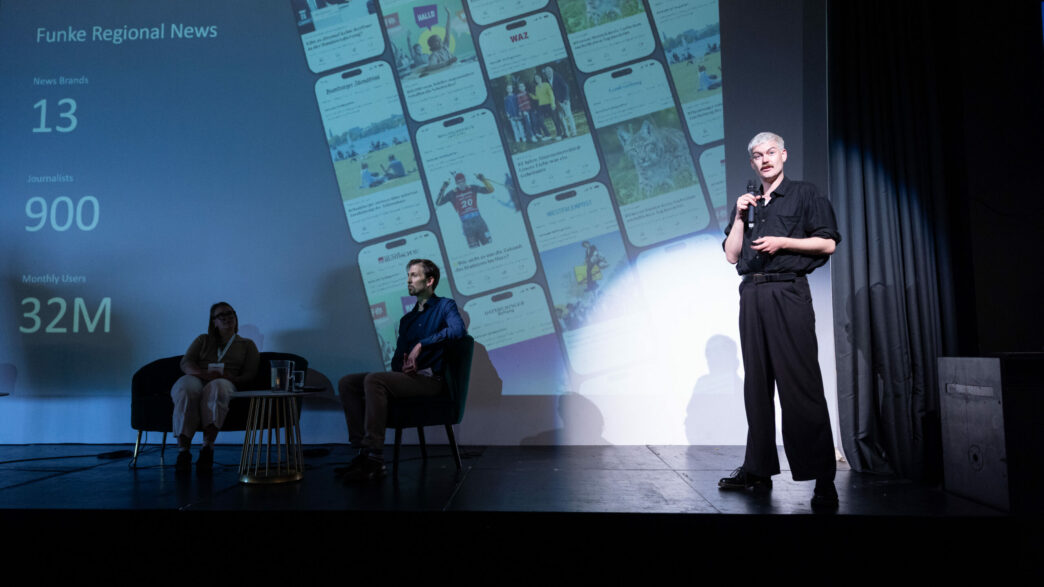
Stefan Schneiderbauer is Senior Product Manager at Funke Mediengruppe, where he is responsible for product and development across 13 regional news app brands. Speaking at Audiencers' Festival London in June 2026, Stefan shared a new framework that he developed to make product decisions in a more structured, data-led way. Not to replace editorial judgement, but to better serve the audiences that journalism is trying to reach.

Paradigms are shifting in real-time: News brands used to compete on access to information. That advantage is largely gone, due to the abundance of daily generated content from all different kinds of sources, AI generated content included. What remains is trust, and trust is earned through the quality of journalism, not the sophistication of the product. How the journalistic core gets expressed and amplified in a digital environment is the job of the product organisation. When the two work in isolation, even the best journalism struggles to build the sustained reader relationships that trust requires. To gain and earn the trust of readers, product and journalism need to work more closely together than ever.

This article is focused on the product side of that equation. Specifically, on how we built a framework at Funke News Apps to make product decisions in a more structured, data-led way. Not to replace editorial judgment, but to better serve the audiences that journalism is trying to reach.

I am responsible for app development across 13 news brands at Funke Mediengruppe. Over the past 12 months we repositioned our apps as a strategic growth pillar, which involved a redesign at scale, bringing development in-house, introducing user-segmented advertising, among many other great developments. I want to share the framework that sits beneath all of it.
How are product decisions actually made?

It is worth asking this question honestly, about your own organisation.

Is it the most senior person in the room? Is it instinct built from years of experience? Or is it different departments each pushing their own priorities, without a shared picture of what the product actually needs? Some news organisations have already built strong product cultures, where decisions stem from shared data and clear goals. For many others, the reality is messier.

The problem is not that any single input is wrong. The problem is the absence of a shared view, one where decisions are understood in relation to each other rather than evaluated in isolation. In practice, what often happens is that each team or department sees a part of the picture and acts on it. Everyone is doing something, but it does not click together, and a lot of value gets lost in the gaps.

When data is also missing from the equation, the risks compound. In product discussions about what to build next, maybe the loudest voice, the most confident person, or the most senior stakeholder gets their way. And maybe their suggestion is the right one. But without a shared framework to evaluate it against, there is a real chance that a lot of value gets lost. Hello, agency theory.

There is also a structural challenge specific to product development: new features are expected to have long-term impact, but evaluating that long-term impact after release is genuinely hard. Who hasn’t heard the famous “We simply have to implement Feature X, then in 6 months PV will have increased by xy%”. Too many things change between shipping a feature and having enough time to assess results. This makes it easy to keep moving by instinct, because instinct, in this environment, is rarely held to account.

So ultimately, the goal is to ground product decisions in evidence, not to take judgment out of the process.

Build the tree first

To solve this, the first thing we did was build a KPI tree.

For us as a news organisation, the metric at the top of that tree is Engaged Time, the total time users spend meaningfully interacting with content in our apps. Users choose to spend their time with us rather than somewhere else. The more intentionally they do that, the more value we deliver to them, and the more value we can generate commercially. When Engaged Time grows, the downstream indicators follow: ad impressions increase, subscription conversion improves, churn decreases.

Starting from Engaged Time, you break it down: what drives it? Session length and session frequency. What drives sessions? Active users. What drives active users? New users coming in, and existing users returning. How do new users arrive? Through different channels, direct, social, newsletter, search, each with its own conversion rate and return behaviour. How do existing users come back? Through habit, through push notifications, through content that gives them a reason to return tomorrow.

At each level of the tree, what you are really working with are ratios. How many visits convert to downloads? How many downloads become active users? How many active users encounter the paywall, and what share of those convert? Each ratio is a product decision waiting to be made. And there is something important about working with ratios rather than absolutes: it is easier to move five ratios by a small amount than to move one ratio by a large amount. The more levers you identify in the tree, the more opportunities you have to create meaningful impact.

The further down you go, the more granular the metrics become, and the closer you get to what we call movable metrics. These are metrics specific enough that a concrete product decision can actually shift them. You cannot ship a feature which directly increases Engaged Time. But you can ship a feature that improves how the homepage surfaces content, which changes the click-through rate to articles, which increases time in session, which moves Engaged Time. If you understand the chain, you know exactly what you are building toward.

Building the tree also means filling it with data. Some of it already exists. Some requires new tracking. The more granular you go, the more likely you will find instrumentation gaps. But as the picture fills in, something useful happens: you stop describing what the product produces and start understanding how it produces it.

The tree can also be filtered by user segment. The ratios look different for subscribers, registered users, and anonymous visitors. Understanding where those differences appear tells you where the most valuable product work is concentrated.

What the tree reveals

One of the most useful things a completed tree enables is simple calculation.

Once you have your first tree filled with data, even if only some branches, you can start to model the relationships between metrics. Take any KPI in the tree that is influenced by two variables below it. Increase each of those variables by five percent in isolation and see what happens to the KPI above. Which one has the bigger effect? A basic sensitivity analysis like this tells you quickly where the highest-leverage opportunities are in your product, and where effort is likely to be wasted.

Once you have identified a movable metric worth pursuing, the next question is how to actually move it. This is where mapping opportunities and solutions becomes important. For any given metric, there are usually multiple opportunities to influence it, and for each opportunity, multiple possible solutions. A structured approach, which opportunity has the highest potential, which solution is the most feasible, is what connects the diagnostic work of the KPI tree to actual product decisions. That process deserves its own deep dive, but it is the natural next step after the tree has done its job.

With that kind of visibility, prioritisation conversations change. Where should product investment go? What should marketing focus on? The tree does not make those decisions for you, but it makes the trade-offs visible. And visible trade-offs are easier to act on than invisible ones. That is the practical value: better prioritisation, and therefore better return on the investments you are already making.

A concrete example: once the tree was in place, we started observing new users as a specific segment. Sessions and page views among this group were dropping off within the first 30 days, pointing to a retention problem the aggregate numbers had been masking. Looking at what differentiated users who stayed from those who did not, the data pointed clearly to push notification subscription as a key factor. Push subscription rate during onboarding became our movable metric for this branch of the tree. We ran a series of A/B tests across the onboarding funnel, which increased push subscribers as a leading indicator, and significantly grew engaged time for this user segment, resulting in a higher 30-day retention rate as the lagging indicator.

From tree to organisation

Once the KPI tree was in place, the structure of the team followed naturally from it.

The tree has distinct branches, and those branches became four operational pillars:

Reach covers everything connected to bringing new users into the app and converting existing web readers into app users. App store presence, referral channel performance, cross-platform conversion. Reach asks: how do we grow the active user base?

Engagement takes over once a user is inside the app. Its mandate is habit formation: building the product and editorial conditions under which users return regularly and spend meaningful time. Onboarding, notification strategy, content personalisation, homepage design. Engagement asks: how do we make the app worth coming back to?

Monetisation is the commercial result of Reach and Engagement doing their jobs well. Ad revenue, subscription conversion, ARPU. Monetisation asks: how do we convert engaged attention into sustainable revenue?

Infrastructure is the supporting pillar: technical stability, data pipelines, analytics instrumentation. Without it, the other three pillars cannot move with speed or confidence. Infrastructure asks: are the foundations strong enough to build on?

And beneath all four pillars sits journalism, not as a pillar but as the foundation. Great editorial content influences all four. It drives Reach through word of mouth and search. It drives Engagement through loyalty. It drives Monetisation through willingness to pay. It makes Infrastructure worth investing in. The product framework serves the journalism, not the other way around.

The four pillars themselves are not a new idea. What matters is what sits beneath them: clear ownership, defined KPI sets, and the mandate for each team to break those KPIs further down within their branch of the tree. Downloads is a Reach KPI. But how are downloads generated? Through app store visits and the download conversion rate. Which of those can be moved? That is where the actual product work begins.

The pillars are independent in ownership but interdependent in practice. Reach without Engagement produces churn. Engagement without Monetisation produces a great product that does not sustain itself. A decision in one pillar usually affects the others.

Working together across pillars

Having clear ownership per pillar solves one problem. It creates another: how do you keep four teams, each focused on their own metrics, moving in the same direction?

This is where the organisational question becomes as important as the product question. Each pillar needs to understand what the others are working on, how prioritisation decisions are being made, and how a new feature or product change in one area will affect the others. Without that shared understanding, you end up with well-run silos rather than a well-run product.

What we built is a cross-pillar structure where all relevant stakeholders, from editorial and data to advertising, subscriptions, and tech, sit down together with the same data in front of them. Each pillar shares its learnings, its priorities, and its dependencies. Where one pillar needs something from another to move forward, that gets named and resolved together.

The goal is not process for its own sake. The goal is to get genuinely data-oriented as a group, not just in individual teams, but across the whole organisation. When everyone is looking at the same KPI tree and asking the same questions about what is moving and why, the conversation shifts. It becomes less about opinions and more about what the numbers are actually showing.

That shift is harder to achieve than it sounds. But it is where the real value of the framework sits.

A new way to think about what comes next

The KPI tree has changed how we make product decisions. The next opportunity is to apply the same thinking to strategic planning.

A user-centric planning approach starts with an understanding of how users move through the product: where they drop off, where they convert, and what drives them to return. Leading indicators first, active users, retention rates, engagement depth, push notification reach. The lagging indicators, including revenue, follow from those.

A subscriber target becomes meaningful when it is anchored to retention rate assumptions, conversion rate assumptions, and active user trends. A combination of leading and lagging indicators, connected through the KPI tree, gives every team a clear view of which part of the tree they are responsible for moving and how their work connects to the overall goal.

But the KPI tree also points toward something bigger. Every data point collected across all KPIs is a training signal. The logical next step is a statistical or AI-driven model that operates on top of the tree and surfaces the highest-leverage actions automatically. Imagine a system that tells you: sending four percent more push notifications related to sport, at 4:30pm, has a 78 percent probability of increasing MAU by two percent, which flows through to a 1.5 percent revenue effect. (Numbers are illustrative to get the point across.) The tree helps you understand your product and it can become the foundation for a system that actively tells you where to act next.

Even if we are not fully there yet, the tree gives us the language and the structure to get there.

Where to start

If you are thinking about building something similar, start with the first draft of the tree.

Start with one branch, not the whole tree. Instrument what you can, show your team what it reveals, and let the results build internal confidence in the approach. The framework earns trust the same way any good product does: by demonstrating value before asking for full commitment. Then expand.

It does not have to be complete. It will not be. Gaps in tracking will appear. Assumptions will turn out to be wrong. Metrics you thought were independent will prove to be connected. Correlation is not causation.

That is the process, not a problem with it.

The value of the tree is not in its perfection. It is in the discipline of building it, because building it forces you to ask, at every level, the question that product decisions too often skip: what needs to happen for this metric to change?

Ask that consistently. Break each number down until you find something specific enough to act on.

And when you find it, build toward that.