Developing an effective audience engagement strategy is a pivotal step on the road towards revenue goals. Not only can it have a direct impact on monetization through impressions and advertising, but more importantly, it can lead to increased loyalty and other behaviors that indicate readers are ready to convert to subscribers.
But how do you go about tracking engagement? And what kinds of soft conversions can you integrate into the reader journey to increase engagement, loyalty, and, ultimately, the likelihood to subscribe?
In this article, we’ll detail why engagement is important, the essential KPIs for tracking it, and how to turn this measurement into actions that will optimize conversion rates.
Measuring engagement and loyalty
Holding readers’ attention is no easy feat when 45% of readers who load an article will leave within the first 15 seconds and more than 60% will not return. So while it’s important to understand how readers are discovering content, engagement comes down to optimizing experiences for the groups that are staying, monitoring the different actions they’re taking on the page, and creating more opportunities for deeper reading.
While the optimal formula for strong engagement is unique to each publisher and audience, the common thread among successful strategies is paying special attention to the following KPIs when experimenting with content and optimizing for loyalty.
Engaged Time
Engaged Time measures the average amount of time that visitors spend actively engaging with a page –– time spent clicking or scrolling, for example. This metric carries more weight than pageviews or time on site because it not only identifies the topics and formats that capture readers’ attention, but the ones that hold on to it as well.
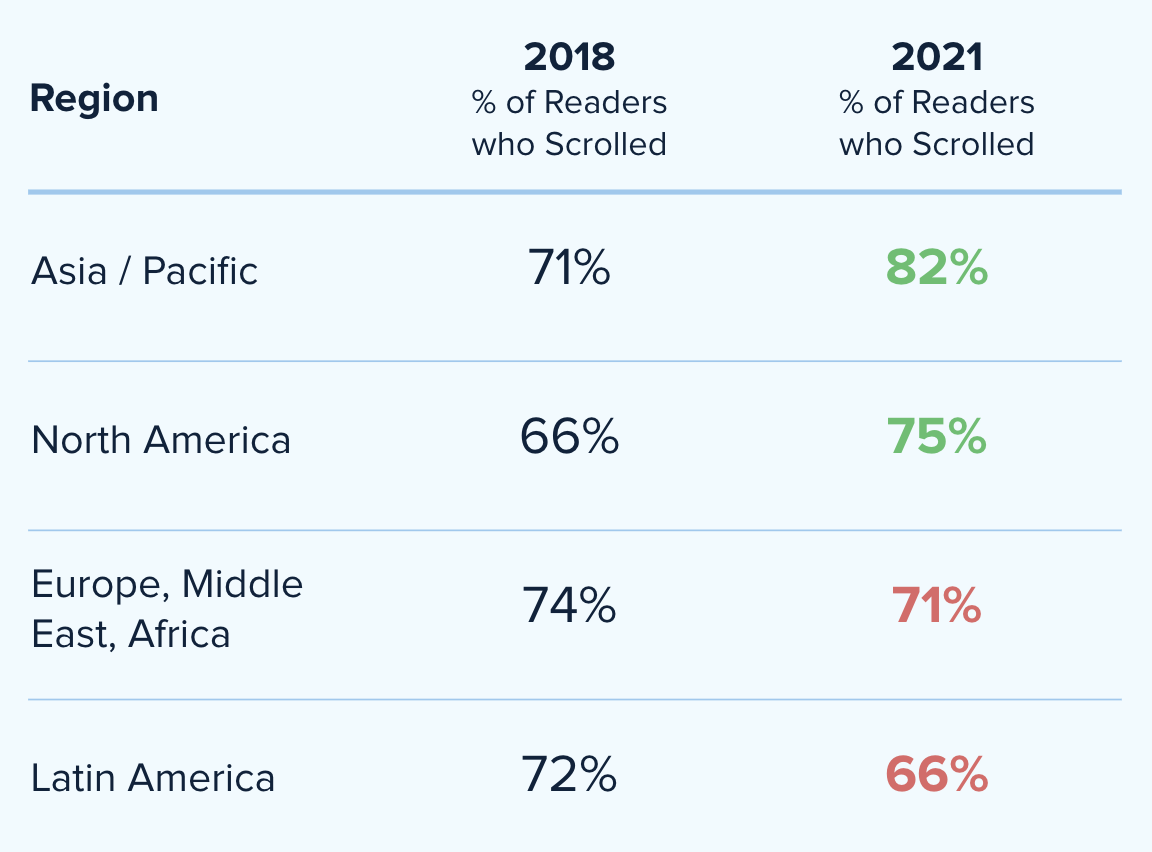
When we look at scroll depth over the past few years, we once again see different regional patterns. In Asia / Pacific and North America, the percent of readers who scrolled increased from 2018-2021 while the reverse was true for Europe, Middle East, Africa, and Latin America.
Recirculation
Recirculation is a real-time metric that compares the number of people on a page to the number of people who move on to another new page from that content. When combined with Scroll Depth, you can see where the majority of visitors are ending their session with a given page and insert links that encourage readers to jump to another article of interest rather than leaving your site. Our research has found that the majority of clicks happen just above the digital fold, at page depths of 400 to 600 pixels, so it’s important to optimize content with relevant links around this location.

Frequency of Visit
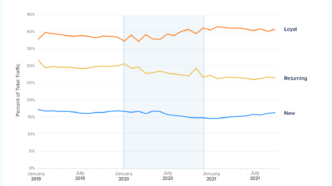
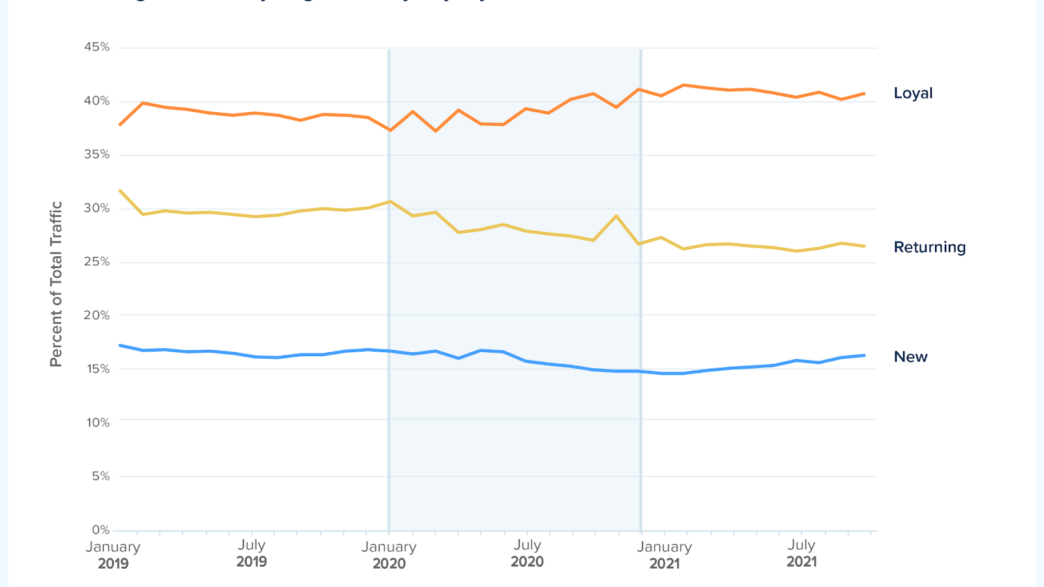
At Chartbeat, we segment visitors into three categories – new, returning, and loyal. New visitors are readers who are visiting a site for the first time in 30 days. Returning visitors are readers who have visited the same site more than once in the past 30 days, but less frequently than every other day. Loyal visitors are readers who have visited a site at least 8 of the last 16 days.
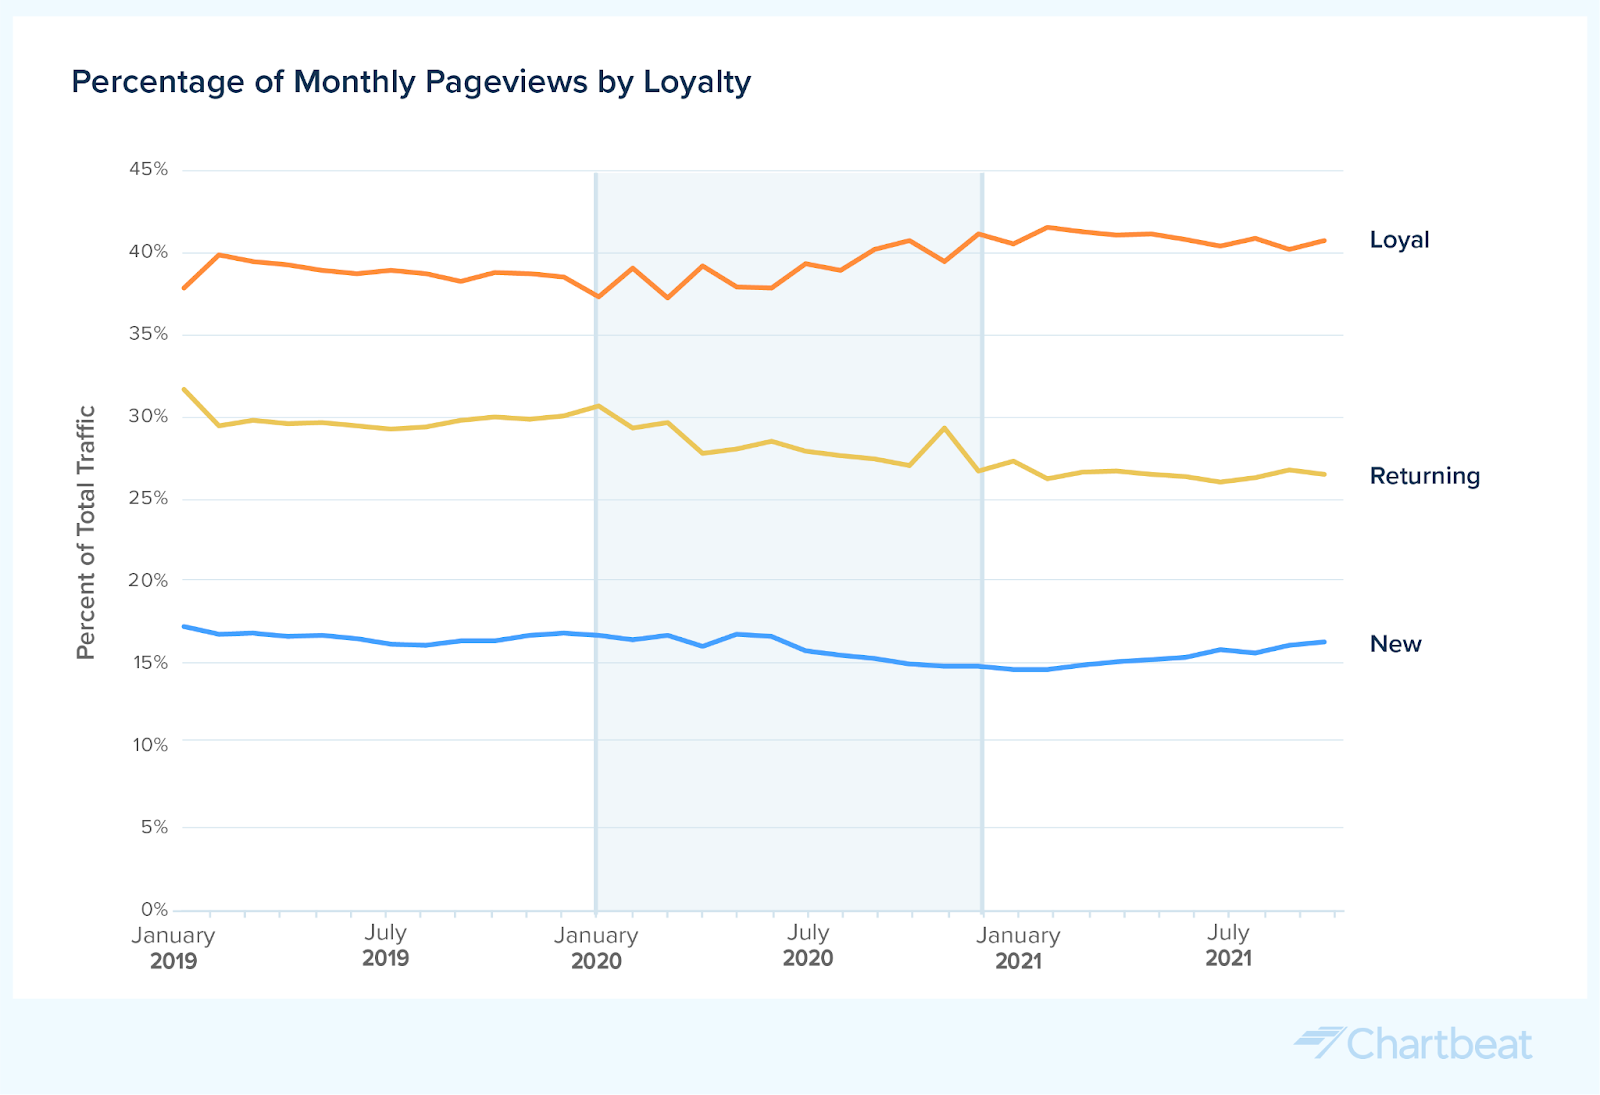
Starting in the second half of 2020, loyal traffic has been rising steadily as a proportion of overall traffic, and from 2019-2021, loyal readers, though smaller in actual number, contributed the highest percentage of traffic at around 40%. Measuring frequency of visit helps to track the evolution of your audience and decide when the time is right to act on these trends.
Turning measurement into action
While measuring KPIs is a necessary step in building engagement, actually creating reader journeys based on this information is what leads to increased loyalty, conversion rates, and ultimately, revenue. For additional data and strategies for moving visitors along the engagement funnel towards subscription, we’ve enlisted the help of Poool, the dynamic paywall solution for publishers, to share insights on the role of audience segmentation and soft conversions in this process.
Audience segmentation
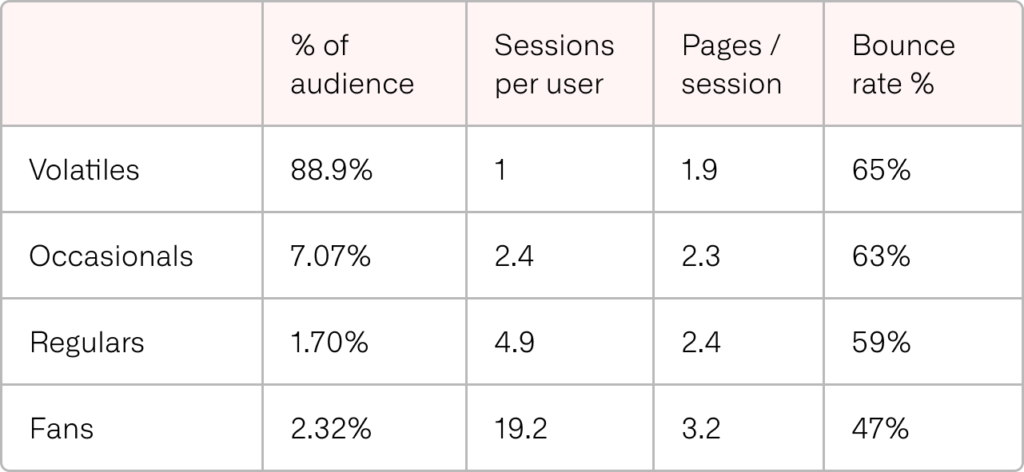
Poool’s first recommendation for personalizing the reader journey is to segment audiences based on level of engagement. Similar to Chartbeat’s frequency of visit metric, Poool segments non-subscribed visitors into four groups — Volatiles, Occasionals, Regulars, and Fans — based on their recency, frequency, and volume score. Recency is the number of days since a user last visited a site, frequency is how often the same individual visits, and volume is the quantity of content consumed and/or the number of actions completed.
To better understand what actions publishers can take to engage each group, Poool conducted a study* of digital publishers that analyzed sessions per user, pages per session, and bounce rate.
Volatiles
As you can see from the data, Volatiles make up the majority of visits at 88.9% of the audience, but they engage with the fewest pages. At this stage, Poool recommends focusing on collecting compliant consent and encouraging content consumption habits. To do this, try offering a limited number of articles for free, encouraging signup for email or push notifications, or prompting visitors to download an app for a better mobile experience.
Occasionals and Regulars
Occasional and Regular visitors are slightly more engaged than Volatiles at 2.3 and 2.4 pages per session, and the focus here should be on developing strong relationships, increasing loyalty, and optimizing the user experience. Poool recommends creating a campaign to convert these users into newsletter subscribers or registered members using soft conversion techniques detailed below.
Fans
Fans are the most engaged non-subscribed users and thus a prime target for conversion techniques. At this stage they’ve demonstrated all the behaviors of a subscribed user and should therefore see paywalls in their journey that create just the right amount of friction to convert them into paying supporters of the content they already consume.
Soft Conversions
After segmenting visitors based on their level of engagement, evaluate the best soft conversion technique to encourage deeper and more frequent visits from each group. For example, rather than confronting new visitors with the decision of a hard paywall, build in a softer checkpoint that promises more content and is easier to say yes to than a subscription.
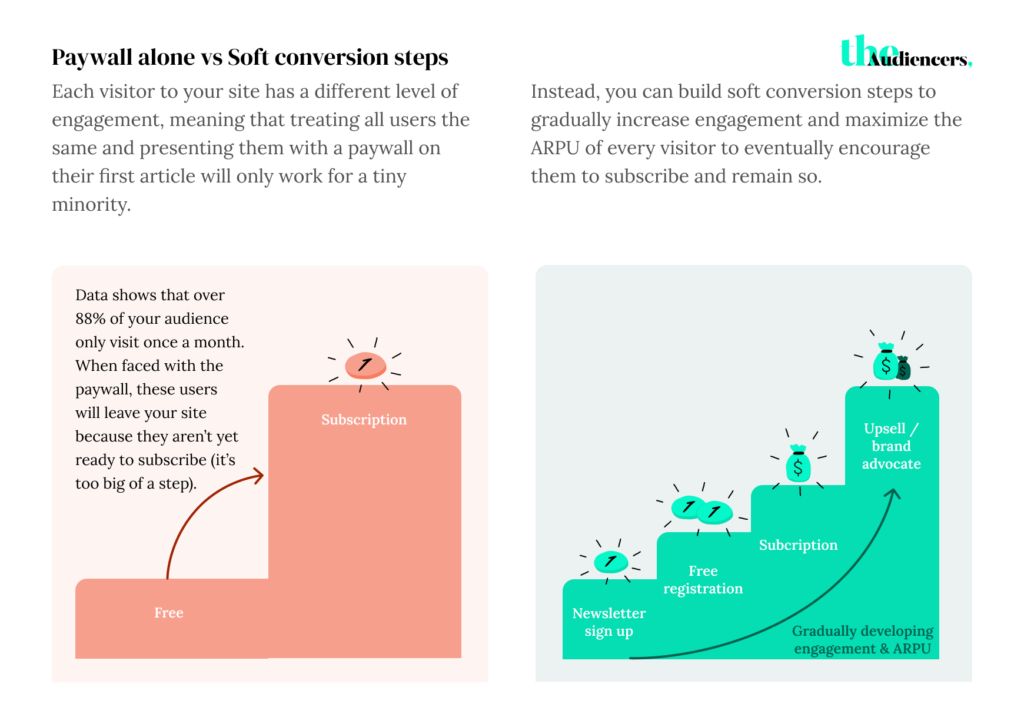
At this stage Poool suggests using a Newsletter or Registration Wall to prompt visitors to sign up for email communications or create a free account in order to access additional content. As these anonymous visitors become registered users, they will consume more content, move deeper into the engagement funnel, and become Regulars and Fans who are much more likely to subscribe than the Volatiles they once were.
A look at the effect of soft conversions
To measure the value of engaging readers through soft conversion steps, Poool looked at the conversion rate for each audience segment on a large digital publisher’s website. As expected, Volatile users had the lowest conversion rate, and there was only a slight increase for Fans, despite considerably more engagement from these users.
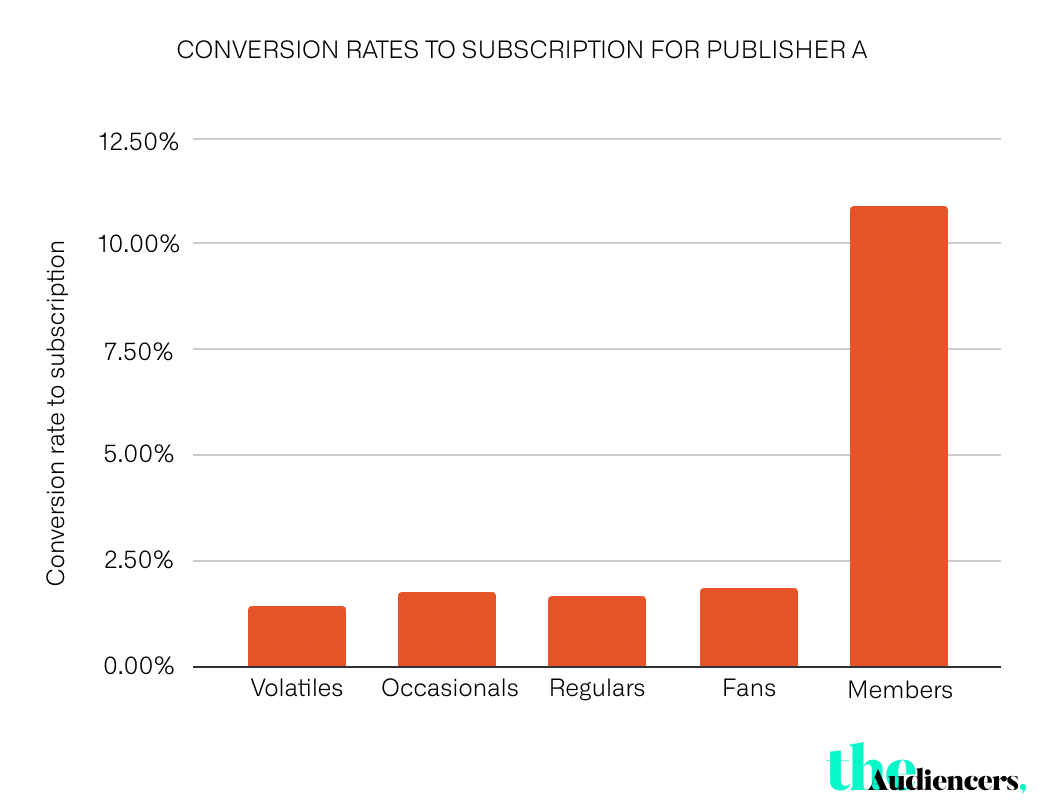
For registered Members, however, the conversion rate jumped to 10.9%. As the segment that was exposed to the most soft conversion steps prior to seeing a paywall, it’s clear that incorporating these events into the engagement funnel is critical to improving conversion rates.
Some other soft conversion KPIs that Poool recommends tracking include:
- User-to-subscriber conversion rate for each audience segment (VORFM – Volatiles, Occasionals, Regulars, Fans & Members)
- Conversion rate on your Newsletter Wall for each audience segment
- Conversion rate on your Registration Wall for each audience segment
- Ratio of anonymous vs registered traffic
The essential takeaway
Getting to know audiences through KPIs like engaged time and scroll depth provides essential context for making informed decisions around what level of engagement visitors need to reach before they’re ready to convert to a paying subscriber. With this information in hand, tactics like audience segmentation and soft conversion steps become much more personal and effective.
For less engaged users, soft conversions can increase the frequency of visit and improve loyalty, moving them closer to subscription. For the segment that’s already demonstrated loyalty, knowing when to place a paywall between them and the content they’re increasingly consuming is the key to optimizing conversion events and realizing a return on your audience-building investment.
*Poool’s study analyzed the digital audience of 42 French publishers producing a variety of written content, including regional and national press, pure-players, and entertainment content publishers. The data collected from visitors to the publisher’s site was then divided into 4 cohorts based on the user’s level of engagement, namely Volatiles (who made up 88.9% of the overall audience), Occasionals (7.07%), Regulars (1.70%) and Fans (2.32%).
Chartbeat is the leading content intelligence platform that gives publishers the data to build loyal audiences with real-time and historical dashboards, in-page optimization tools, and robust reporting across desktop, social, and mobile platforms. Read more research and insights on their blog or book a demo of the platform.
Poool is the Audience Conversion Platform for digital publishers to take back control of their revenues by converting users into consented leads (via a Cookie Wall), members (Registration Wall) and subscribers (Paywall).