
In brief:
- Given that page-views are the key metric in most newsrooms, journalists are often unaware of the true business value of each individual article they publish
- Instead, publishers should make their whole company aware of two key metrics: Customer Lifetime Value and the revenue generated from every 1,000 page-views (RPM)
- Metrics matter and should reflect the revenue model that your business is working from...
“If newsrooms could view successful coverage not just as content that generates clicks, but also as journalism that delivers value to subscribers, it stands to reason that they would respond to those cues in the decisions they make day-to-day.”
Matt Skibinski, reader revenue consultant, Neiman Lab.
In fact, it’s something that can be applied to most teams working in a publishing company – whilst advertising people may solely look at ad metrics, subscription people will focus on subscription metrics, and journalists will concentrate on outdated metrics such as how often their content made the front page… but nobody puts these metrics together to get a clear view of how the business as a whole is performing.
Which raises a very important question, one that journalists, ad and subscription people should probably consider…
Would it be more valuable for an article to generate a high number of page-views or successfully convert a user into a subscriber?
Although the answer’s still being worked out within the industry, Skibinski shares research and metrics to point us in the right direction.
2 key metrics for unit economics
1. Customer lifetime value (CLV or CLTV)
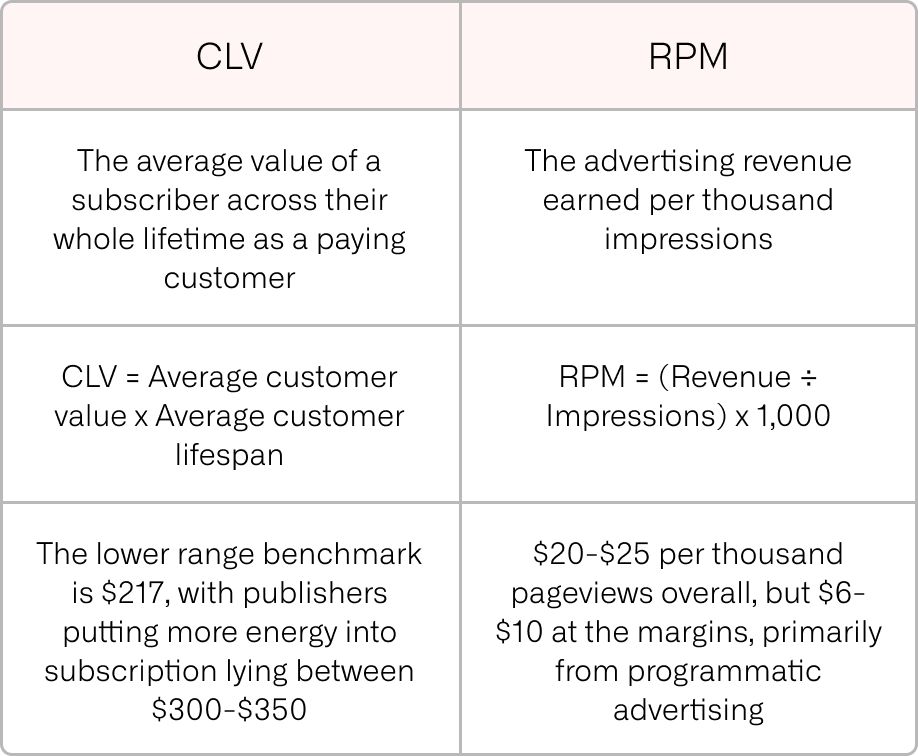
A well-known metric among subscription-based businesses, CLV measures the average total net revenue that you expect a subscriber to bring to your business throughout their entire time as a paying customer.
Although there are a variety of ways to track CLV, the simplest form is
CLV = Average customer value x Average customer lifespan
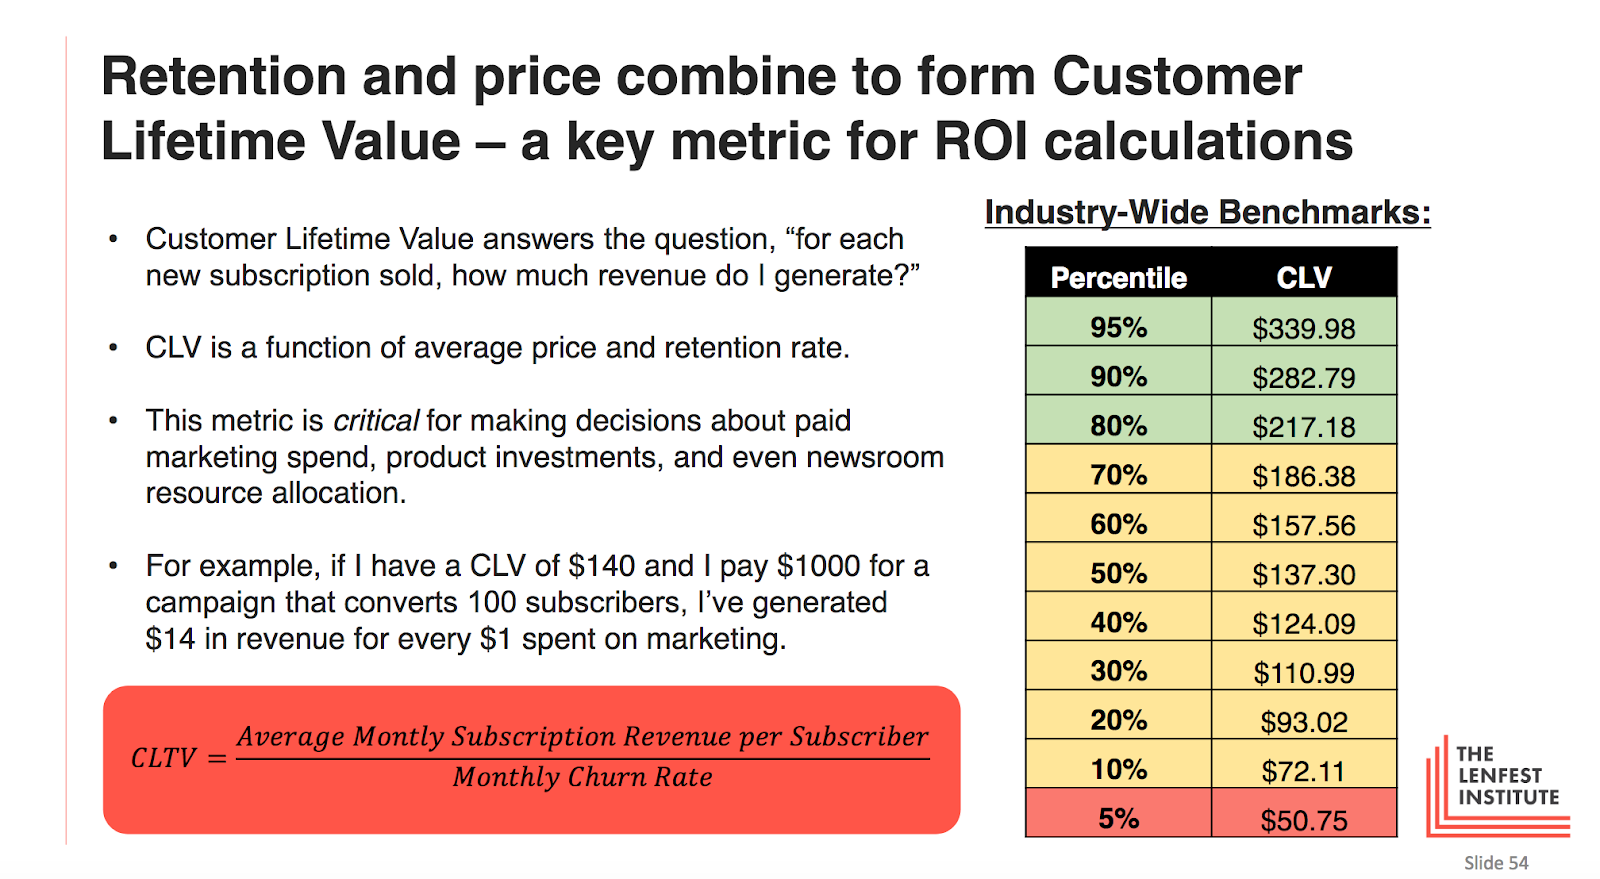
For instance, say we charge an average of $9 per month for subscription and, on average, these users remain subscribed for 20 months, then the CLV would be $180. Concretely, this means that each new subscriber will (again, on average) bring $180 to the company.
Of course, this doesn’t take into account the cost of acquisition (Customer Acquisition Cost, CAC), worked out by combining all costs associated with marketing and advertising efforts divided by the number of subscribers generated.
Customer Acquisition Cost = Acquisition costs per month ÷ customers acquired per month
You can then subtract this cost from the CLV to find your overall profit from subscribers.
What’s more, comparing these two KPIs will give you insights into the health and sustainability of your subscription model. If we consider the ratio LTV:CAC, a 1:1 ratio would mean that you’re losing money with each subscriber acquired and that the strategy isn’t sustainable for long-term growth. A 3:1 ratio on the other hand is considered the ideal benchmark for most businesses, representing a sustainably profitable model.
Skibinski highlights that although most publishers will have some form of CLV calculation, it will likely only be understood by finance or consumer marketing departments. Anyone outside of this small group typically doesn’t know this number, but it could certainly prove valuable if they did.
> You’ll also enjoy: A whistle stop tour of the wondrous world of Lifetime Value
2. Digital advertising revenue per 1,000 impressions (RPM)
Previously reserved for advertising or managerial teams, it’s time for RMP to make its way into journalist’s key performance indicators.
RPM allows publishers to understand the revenue earned per thousand impressions.
RPM = ( Revenue ÷ Impressions ) x 1,000
So, say we want to calculate the RPM for September 1st, 2022 when the site earned an estimated $133.04 for 104,752 ad impressions.
RPM = ( 133.04 ÷ 104,752 ) x 1,000
RPM = $1.27
An important precision for journalists – not every page-view generates the same amount of ad revenue and it’s highly dependent on context, device and the quality of data available.
Skibinski therefore recommends tracking RPM for programmatic advertising only, and reserving this metric for content pages – other pages are of course still relevant to the overall business but are less relevant to the impact that one article or another might have on the business.
In summary, the two metrics to track:
OK, great, but which metric is more valuable?
Lenfest helpfully provide a case study to illustrate their point:
This metro daily newspaper, publisher A, has a fairly high CLV of $345 and generates $21.44 in total advertising per 1,000 pageviews, or $7.16 per 1,000 pageviews from programmatic advertising only.
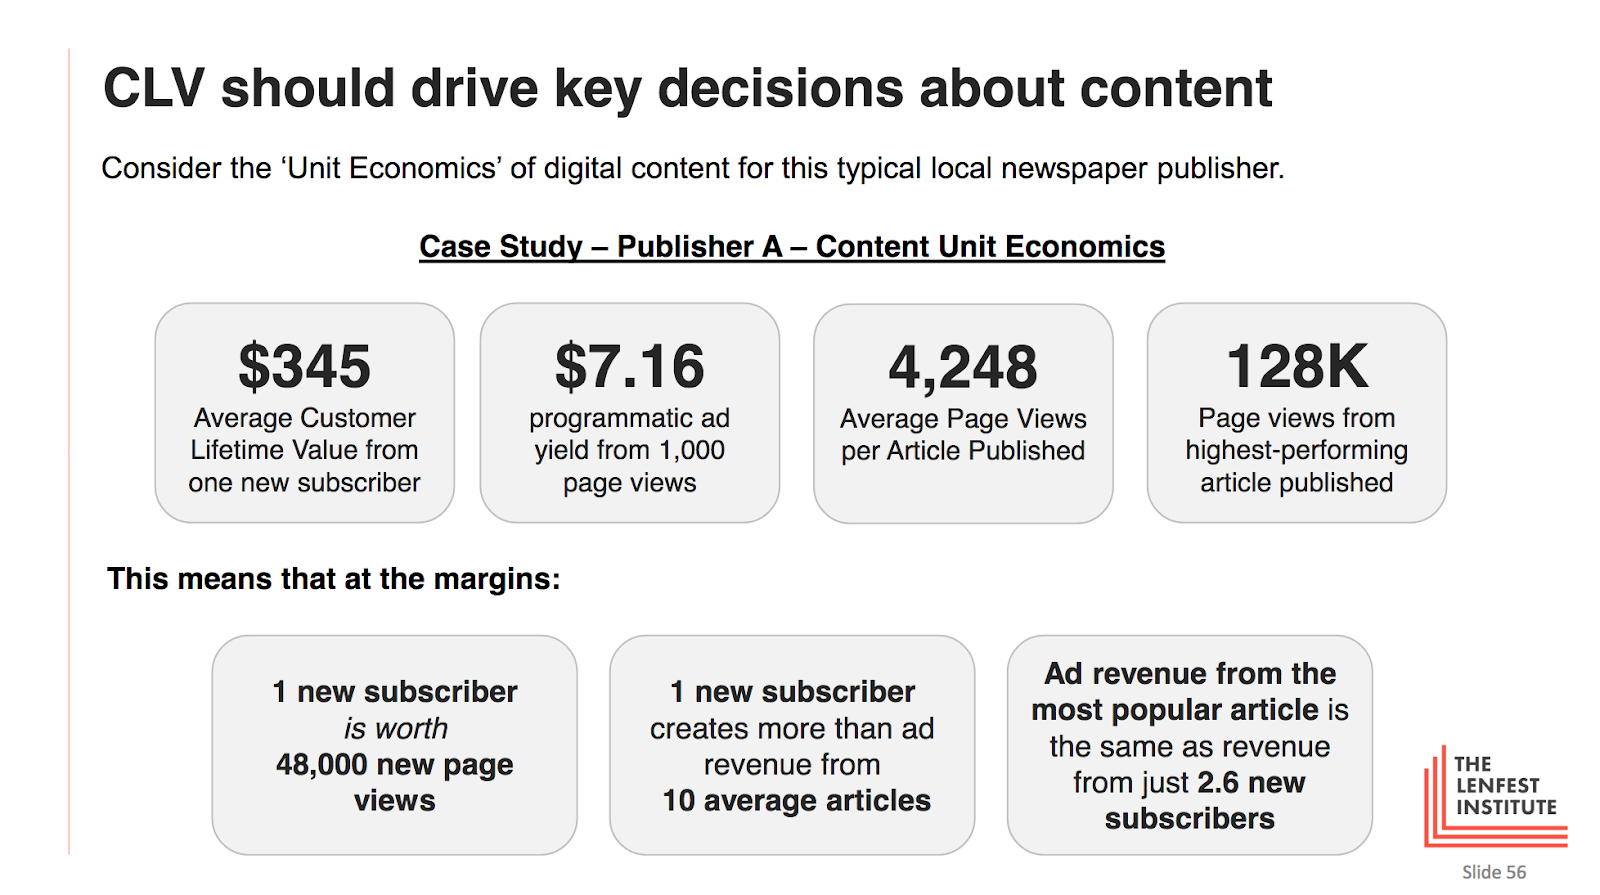
What can we take from this about the publisher’s unit economics?
An article that converts 1 user into a subscriber will generate the same amount of revenue as an article that receives 16,000 page-view if advertising is sold directly, or 48,000 views if sold through programmatic advertising.
To reach these figures:
CLV ÷ RPM x 1,000
For direct-sold advertising: $345 ÷ $21.44 × 1,000 = 16,090
For programmatic advertising: $345 ÷ $7.16, × 1,000 = 48,184
Looking at the data for Publisher A’s content, the average article generates about 4,250 page-views in the month following publication. This means that an article that converts one new subscriber will generate the same revenue as about 10 average-performing articles (from programmatic ads).
This kind of data and understanding about unit economics could prove invaluable to journalists, driving key decisions about content.
> To read next: The essential engagement KPIs for optimizing conversion rates
How would combining these metrics support subscription business models?
What would happen if publishers shared this kind of data with the whole company, including the newsroom?
In short, metrics matter.
Today, the metrics shared within and available to journalists are primarily measures of total reach – lists of articles classed by page views, and sometimes other engagement metrics such as time spent on page. This leads to content being written with the goal of producing a high number of page views, with click-bait headlines or by covering widely-talked-about topics without sharing anything new.
And it’s widely understood that this kind of coverage isn’t going to attract and retain subscribers….
If, however, we change the key performance metrics to focus more on delivering value, journalists would adapt writing accordingly, covering niche topics, distinctive, local reporting that’s relevant to their daily lives. I.e. content that solves a pain point or helps users achieve a job-to-be-done. Content worth paying for.
“If newsrooms could view successful coverage not just as content that generates clicks, but also as journalism that delivers value to subscribers, it stands to reason that they would respond to those cues in the decisions they make day-to-day.”
4 simple starting points recommended by Skibinski:
- Ensure everyone in the company understands and knows key metrics such as CLV and marginal ad revenue
- Daily or weekly reporting shared cross-company on the number of user-to-subscriber conversions, and from which sections of the site
- Report and share information on subscriber content consumption – this can tell you a lot when compared to the articles being clicked on by non-subscribers as well as potentially which type of content is likely to convert users into subscribers
- Consider experimenting with content attribution reporting – find the content attribution model that best matches your goals (such as last touch, i.e. the last content that was consumed before a user chose to subscribe) and rank articles based on this
Looking more broadly, combining these metrics will help publishers to better allocate resources, with a new-found understanding of the value of subscription vs advertising, as well as make decisions about which content to place behind a wall, how many articles to offer for free in a metered strategy, etc…
The value of these metrics is endless, but it’s this that will transform publishers from acquiring eyeballs to subscribers.