The context of Grupo Globo
Established in 1965, Globo has risen to become one of the most influential media and technology organizations in Brazil. It operates across various sectors, such as television, newspapers, digital platforms, and content production. Notably, it manages popular entities like Rede Globo, Globo.com, G1, Ge, Gshow, Receitas, the game Fantasy Game Cartola, as well as Podcasts/Videocasts and the streaming service GloboPlay. Globo’s cultural and social impact on Brazil is prominent, shaping trends and offering extensive coverage of sports, news, and entertainment.
Its digital offerings like G1, Ge, Gshow, Receitas and Globo.com are freely accessible to the public, with advertising serving as the main monetization strategy. While registration isn’t mandatory, users who choose to log in can access additional features and, in turn, generate extra advertising revenue.
Crafting a vision for the digital portfolio
Managing such a varied portfolio is no small feat. It involves the intricate task of handling content distribution, advertising revenue, and audience development. One of the challenges we faced was finding a metric that accurately measured the success of our strategy to promote a diverse range of topics to our users.
We have attempted to use tools like Google NCI’s user segmentation in the past, which focuses on the time spent on content and user loyalty (measured by the number of content visits). However, this approach fell short of providing a comprehensive understanding of our portfolio, as it lacked the necessary metrics to capture the complex relationship between a consumer and our product.
To address these challenges, the Digital Products and Paid Channels team initiated a project to develop a new framework that could accurately measure the level of attention and user retention across the portfolio. The primary objective was to devise a metric that was not only interpretable but also actionable and correlated with our primary indicators of success, such as monetization.
Charting the user journey and cultivating habits
Creating this metric required a comprehensive evaluation of what could be considered as consumption. To be more precise, what frequency of consumption is necessary for a user to be classified as ‘engaged’?
This understanding was particularly crucial given that our products didn’t have formal contractual relations with consumers. The vast number of digital products available can result in diluted consumer attention.
Consequently, the first step involved establishing a structured user life cycle, meticulously identifying the various behaviors exhibited at each stage of their journey:
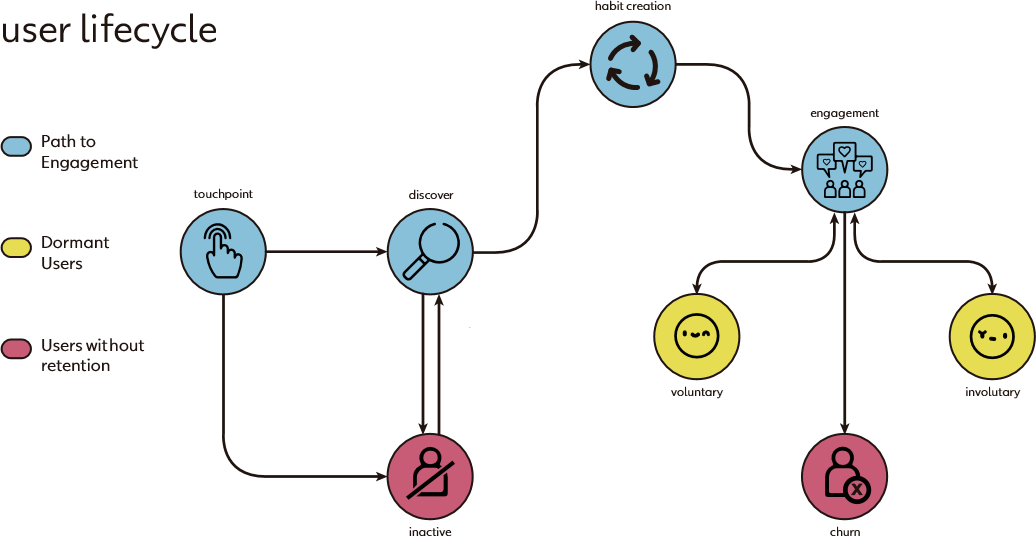
The design of this map is fundamentally predicated on assessing the user’s current level of activity on our products. For example, we can observe a transition towards lesser activity. It is crucial to discern which users are diminishing in their engagement and ascertain the underlying causes to refine our strategies for re-engagement.
Revisiting our metric, an analysis of the map post-initial user interaction reveals a tendency towards the establishment of a stable and consistent pattern of usage. This observation facilitates the determination of what we describe as the ‘minimum engagement level,‘ an instrumental metric that provides foresight into a user’s prospective engagement and retention likelihood from a specific calculated threshold.
In delineating the scope of ‘minimal engagement,’ we explored a spectrum of conventional engagement metrics (such as metrics typical of advertising and content consumption, including visit frequency, articles read, etc.). These metrics were correlated with retention indicators; for instance, identifying the threshold number of articles per week that qualifies a user as minimally engaged, thereby positioning them within the realm of habitual engagement.
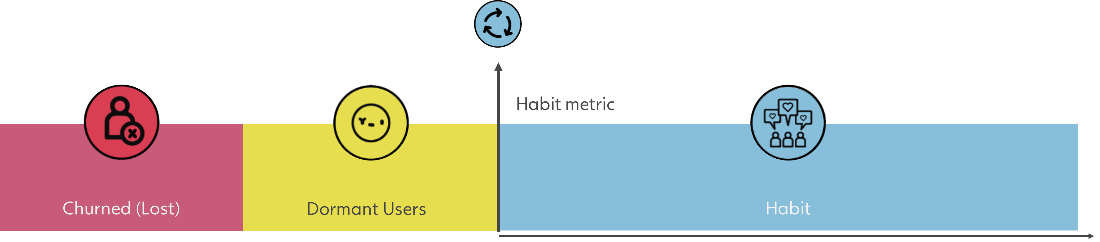
There are two possible outcomes at this stage in the user life cycle:
- The user achieves the minimum engagement level, making them more likely to stay engaged with the portfolio than those who don’t achieve this level
- The user fails to achieve this level and other strategies are needed to boost engagement, either through resurrection or acquisition
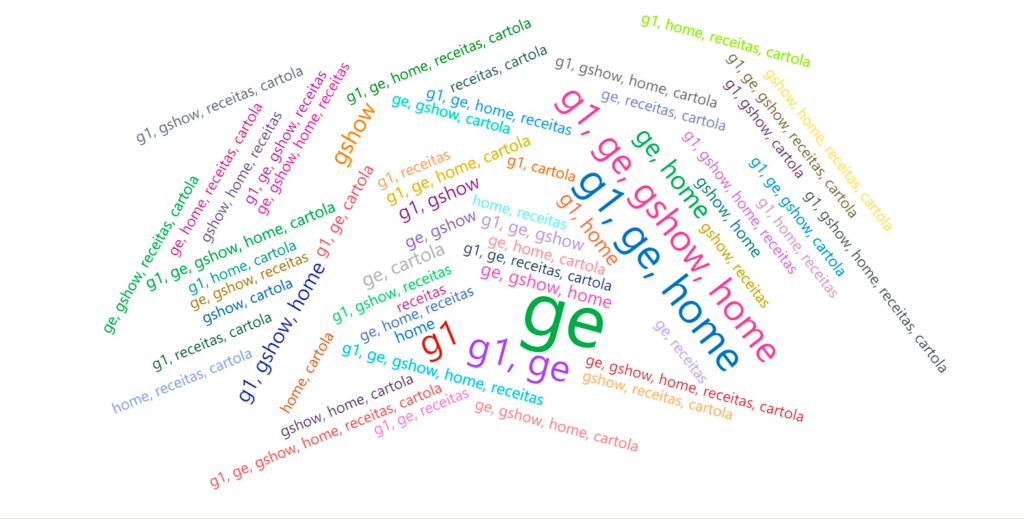
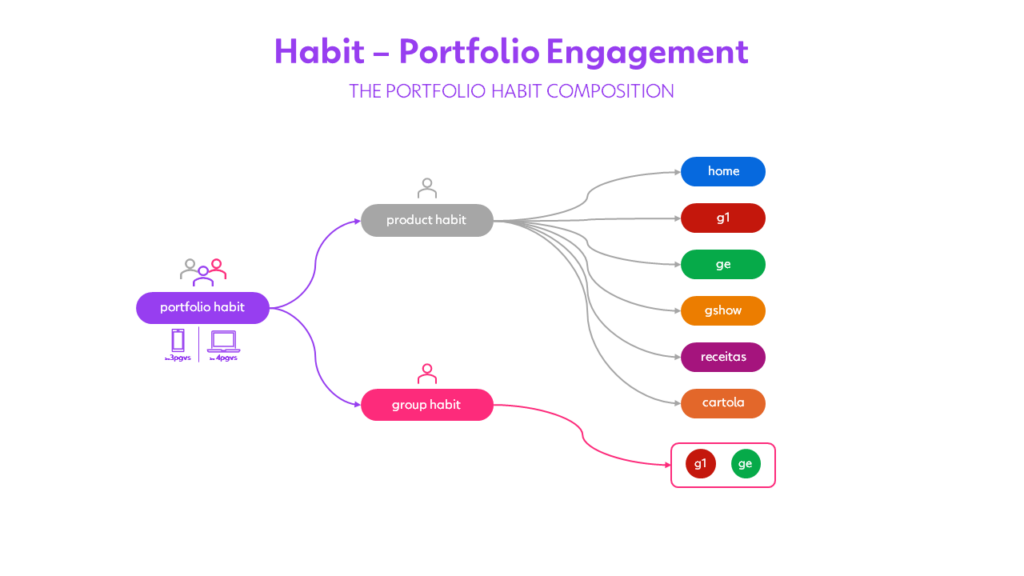
In aligning the conclusion with the preceding analysis, two distinct consumer segments were identified within our portfolio: individuals committed to a single product and those who diversify their usage across multiple offerings. This segmentation is based on the patterns of consumer engagement observed, highlighting a division between consumers who consistently interact with one product and those who seek a broader range of experiences.
How is our engagement metric calculated?
Habit-forming factors indicate not only the degree of habit evolution but also that regular users who reach a certain activity level are likely to keep using the product.
We’ve developed an index for gauging user engagement throughout the portfolio. This index is calculated for each user, integrating diverse concepts. We’ve used the tried-and-true RFV model for this purpose.
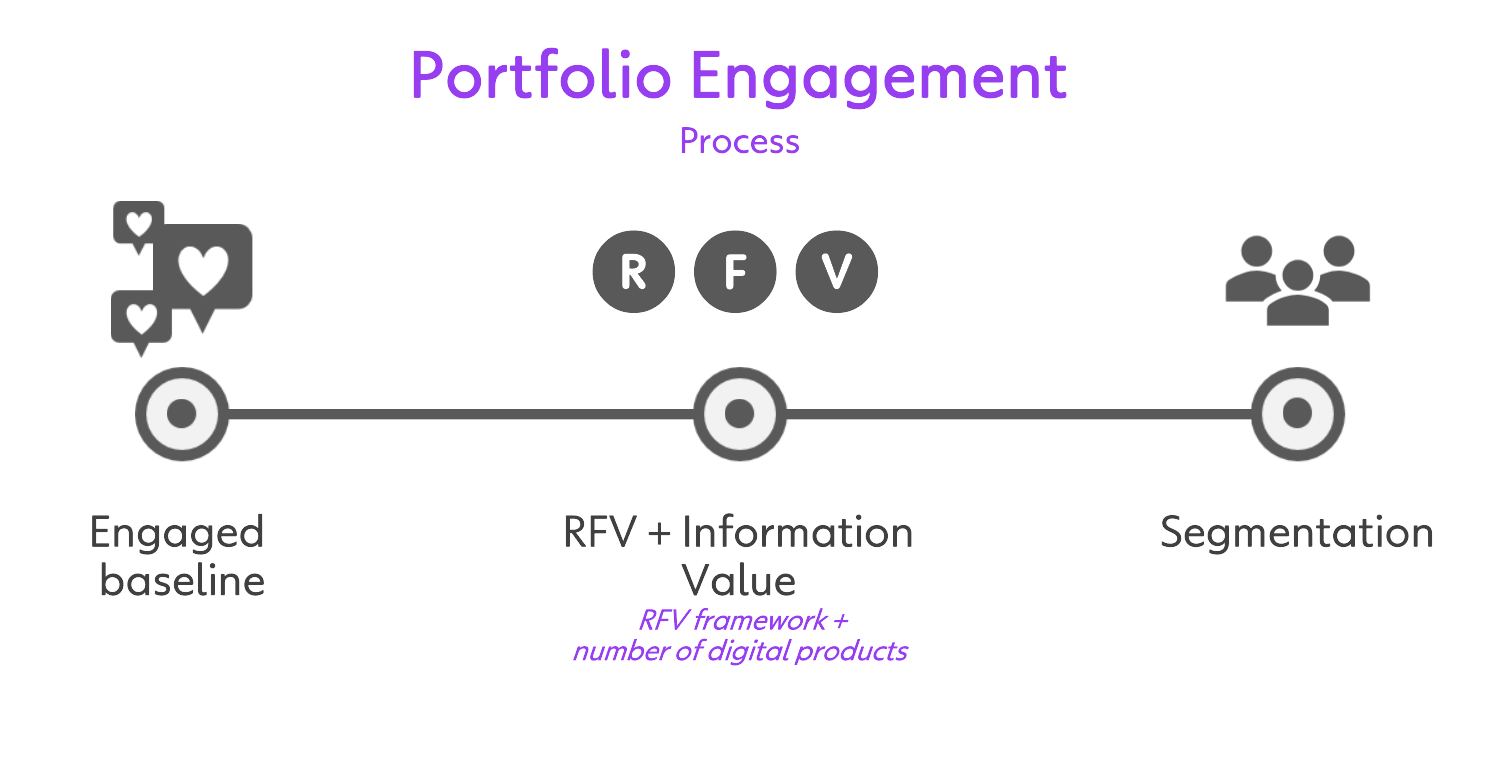
We chose the RVF for its simple calculation and practical components. We kept the ideas of recency and frequency close to their normal meanings, with a few time frame adjustments. The monetary value, which aligns with our main distribution and advertising methods, represents each medium’s consumption volume.
Understanding the habit-forming behavior and that it links to a reader’s loyalty to one product or varied consumption from our portfolio, we added a metric to this RFV score: Variety of Accessed Products. This addition lets the model measure user movement through Globo’s digital product ecosystem.
We conducted many analyses on the raw event data that make up the index calculation. The goal was to understand the sample components’ distribution. After specific treatment, a combination of factors produced a single representative dimension. We have created the user engagement score by reducing dimensionality and preserving maximum information. It is normalized (on a 0 to 1 scale), enhancing its interpretive power.
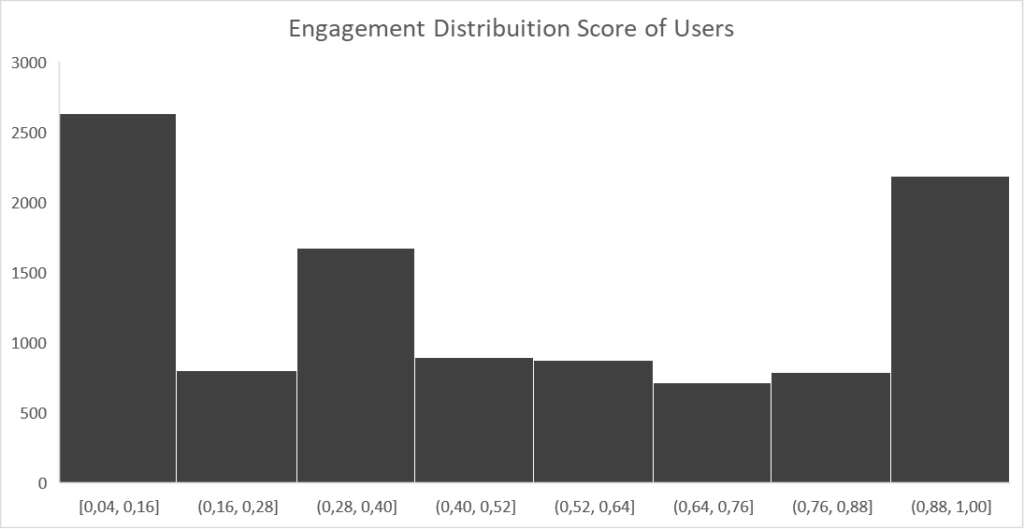
Engagement score analysis provides an overview of user behavior, indicating the presence of different groups. Each group displays unique engagement patterns, shaped by shared interests and actions. This not only shows how users engage with content but also identifies potential target segments for tailored engagement strategies.
The study of user engagement revealed significant trends in product dynamics, particularly in the context of user communities. For instance, we discovered groups of users who are highly loyal to certain communities, demonstrated by their consumption of G1 and Globo Esporte within the same week, which is indicative of high retention levels. Therefore, despite the wide array of digital products affecting users, their consumption patterns remain stable.
The synergy between G1 and Globo Esporte proves to be quite noteworthy, as both platforms are digital news outlets. G1 offers coverage on a broad spectrum of topics, including sports, whereas Globo Esporte focuses exclusively on sports coverage. This includes major events like the Brazilian Football Championship, FIFA World Cup, Copa Libertadores, UEFA Champions League, Olympics, NBA, and other competitions. Therefore, their synergy primarily arises when they share content related to sports events or news that appeals to their shared target audience.
The engagement analysis project has paved the way for a tailored strategy that leverages insights from organic group trends, enabling the creation of content and interactions that resonate deeply with the unique interests of each user niche. This strategy, informed by a comprehensive understanding of user engagement patterns, not only enhances the relevance and value of the user experience but also weaves a more engaging and meaningful narrative around the brand.
> You’ll also like: How we measure audience engagement at DER SPIEGEL
Aligning engagement and strategy
Recent internal studies have identified the most common combinations of products that regular users consume. These users show strong loyalty to their chosen recurring consumer products. This indicates that they have set habits, which can guide strategies to improve engagement.

The engagement analysis project identified key user interests and provided an in-depth understanding of content engagement levels. It highlighted popular areas such as sports, politics and economics, and identified primary site access routes and traffic sources. The impact of products within our digital offerings was also evaluated.
The project has significant potential for various research and practical applications. These include using engagement segments for content recommendation, testing content delivery methods, implementing user satisfaction surveys, and creating research and development reports.
Conclusion
Understanding user engagement and identifying user groups are useful for improving strategies. These insights allow us to make our approach not only more efficient but also more personalized. This way, we can provide innovative and engaging experiences.
In the future, we’re open to working with different departments and exploring the digital product ecosystem. This will greatly increase our reach and enhance our strategic vision, allowing us to include products from various categories and increase our market impact.
Architecture
Globo’s data lake can be found on Google Cloud Platform – GCP, all data architecture, modelling, exploratory analysis and project automation were developed using Big Query e Databricks. Both tools facilitated integrated development for analysts, scientists, and engineers throughout the entire project.