

A/B testing is essential to being successful in the subscription business. Whether Spotify, Netflix, Disney or The New York Times - everything is tested before it is rolled out on a large scale.

I have conducted over 100 A/B tests in the last few years and would like to share my top 4 learnings. Although these insights come from a non-data perspective, they are particularly valuable for anyone approaching the topic from a product or growth perspective. My learnings should serve as an impulse for you to delve deeper if you are interested.
1. Pay attention to the novelty effect
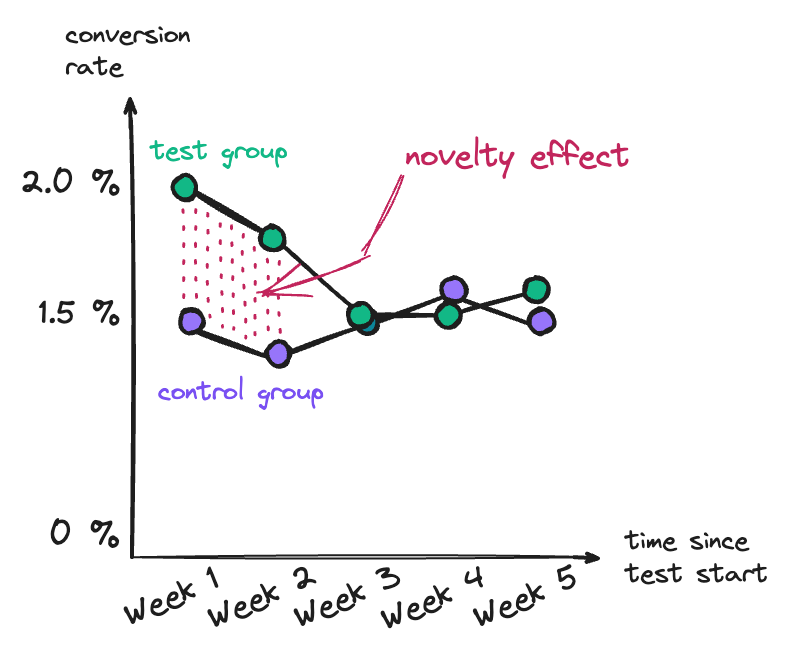
A common stumbling block in my A/B testing was the exciting first uplift. After a week of testing, you look at the initial results and see a big uplift in the test group.
But be aware that this gain often disappears after a few weeks, a classic sign of the novelty effect. Returning users in particular can be tempted to behave atypically in the short term in reaction to new elements such as a new paywall layout or different features.
To ensure you don’t fall for such test results, I recommend:
- Extending the testing time: A longer testing period helps distinguish initial excitement from real improvements. A declining difference between the test and control groups over time indicates the novelty effect.
- Analyze first-time visitors: If first-time visitors don’t show any significant differences between the test and control groups, but returning visitors do, then take results with a pinch of salt.
> You’ll also be interested in: A/B testing paywall benchmarks
2. Determine the test size in advance
It’s frustrating to discover that test and control groups were not large enough to provide valid results – especially when the test has already been completed. To prevent this, it’s crucial to calculate the ideal test size for your A/B test in advance.
The need-to-know about significance:
Not every change is an improvement. Which is why it’s important to understand statistical significance:
- Significance level: By default we use 5%, which means that we have a 5% probability of assuming an effect that doesn’t actually exist (Type I error). For smaller volumes, a level of 10% or lower may also be acceptable.
Tools like abtestguide.com allow you to check the significance of your results and experiment with different levels.
To determine the size of your test group before starting the test, Evan Miller’s sample size calculator will help you. This saves you a rude awakening later in the test, and also helps you to plan the timing of your A/B tests.
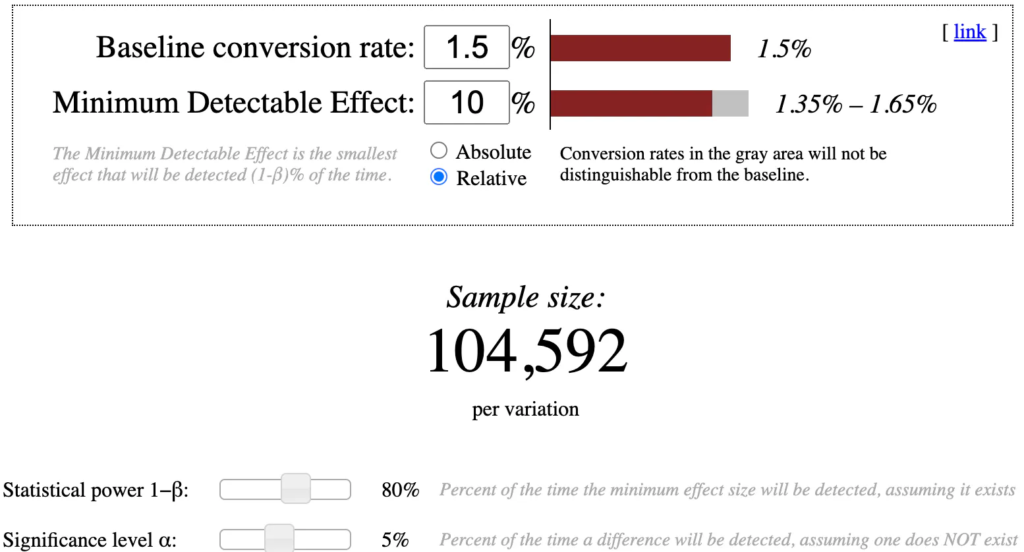
As an example, let’s assume you want to test which subscription benefits to promote on your paywall. This should increase your standard 1.5% conversion rate by at least 10%. When determining your test size, you take the following into account in Evan Miller’s calculator:
- Base rate: The standard form of the KPI to be considered. In this case 1.5% (conversion rate).
- Minimum Expected Improvement: The smallest effect you still want to see, relative to the base rate. Here, 10%.
- Alpha: The chosen significance level, 5% or 10% depending on your risk tolerance.
- Beta: The test power, usually at 80% (Beta = 0.20), indicates the probability of not detecting an effect even though one actually exists (Type II error).
For our example you would have to fill out the calculator like this:
🤖 It’s even easier with ChatGPT! Prompt for this:
My conversion rate is 1.5%. I hope my measure will result in an improvement of 10%. Tell me, according to Evan Miller, how large my test group needs to be at 5% significance.
3. One KPI per test
In every A/B test you should focus on just one KPI. Decide on a specific metric for each test, be it increasing conversion rates, improving click-through rate on the paywall, increasing dwell time, or page views per visit.
I know from personal experience that it’s tempting to look for positive signals, especially when a test doesn’t show clear results. We all desperately want our efforts to be rewarded. But be careful – the more KPIs you evaluate in an A/B test, the higher the probability of finding random positive deviations.
Let’s take our A/B testing example from above. You’re running a test to see if a new paywall layout, with different subscription benefits, will increase conversion rates. In this case, conversion rate should be your only KPI. If you also look at other metrics such as click rate or dwell time, you increase the risk of mistakenly identifying positive effects.
This risk is known as the Family Wise Error Rate (FWER). If you check the significance at 5% in an A/B test and only focus on one KPI, the risk of making a Type I error is a maximum of 5%. However, if you test seven different KPIs in the same test, the risk increases of around 30.17% that at least one of these KPIs will be incorrectly considered significant:
FWER = 1 - (1 - 0.05) ^ 7 ≈ 30.17%
This highlights the importance of focusing on just one KPI in each A/B test to ensure methodological cleanliness and statistical accuracy.
4. Alternative option
Not every publisher has the opportunity to mobilize enough users for significant A/B tests. And honestly, no one wants to run a single test for 3 months or longer. Larger publishers also face this challenge for tests further down the funnel, such as those around churn.
But before you rely completely on your gut feeling, usability tests can be a helpful alternative. They don’t provide a clear statement as to whether a measure will bring X percent more conversions or less churn, like A/B tests do. However, they do offer valuable insights to make more informed decisions.
During a usability test, you observe and analyze how users complete certain tasks. You receive feedback directly through surveys or indirectly by observing their reactions.
Let’s take our familiar example again. You guide users through different paywall versions (with and without subscriber benefits listed on the wall) and collect feedback on clarity, persuasiveness and user decisions. Typical tasks could be:
- Evaluate paywall information
- “Consider the information on the paywall. Please let us know what you think about the information presented and whether or not it influences your decision to proceed.”
- Goal: Gather feedback on the clarity and persuasiveness of the information on the paywall, both with and without benefits.
- Decision-making process
- “Please decide whether you would click the button on the paywall to gain access. Explain your decision to us.”
- Goal: Understand user decision-making and the factors that influence it, especially the influence of benefits.
- Compare the variants
- “Here are two versions of our paywall: one with benefits and one without. Please compare them and let us know which version makes you more likely to click and why.”
- Goal: Directly compare the two versions to determine which is more effective in terms of user experience and increasing click-through rate.
5-8 conversations are often enough for meaningful results. Tools like maze and rapid user testing can be helpful for unmoderated tests.
By the way, usability tests and interviews also ideally complement A/B tests. They not only help you with optimization, but also provide information about why users behave the way they do.
I hope that these learnings are useful for your future testing projects and wish you much success in your next tests.
Speak German? Subscribe to Sascha's blog, Sub Growth or follow him on LinkedIn! "In this blog, once a month I take a fresh and in-depth look at proven growth tactics that are specifically designed to advance the subscription business of German newspaper publishers. By sharing tried-and-tested frameworks, interesting benchmarks and exciting best cases, I want to provide practical and applicable insights that will help you in your work."