“By using this reader-focused methodology, many publishers have been able to better understand their audiences, pinpoint exactly where they’re seeing the biggest loss in traffic, and then take very targeted corrective action. The result: more accurate, more effective efforts and a more rapid increase in conversions.”
Anthony Ribeiro, Consulting Lead at Poool
In this first-of-a-kind study, Membership & Subscription Suite provider, Poool, shares benchmark data from their digital publisher clients across the world. After collecting, categorizing and anonymizing key data points, the Poool team have put together this report, analyzing results as well as providing optimization techniques for each step in the funnel towards subscription.
Methodology & data collection
Poool analyzed conversion data from 85 brands in 10 countries around the world, including France, Australia, Belgium, Luxembourg, Slovenia and South Africa. The average page views per month for these digital publishers lies at 5,008,962, ranging from 10k – 40.8M.
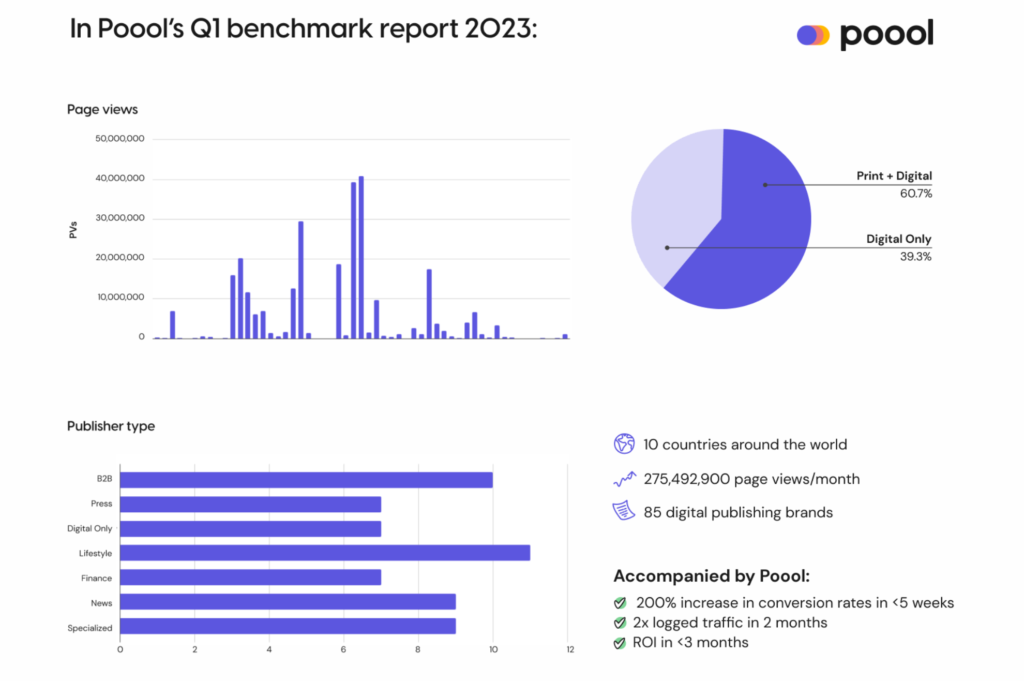
Data was collected from September 1st to November 30th 2022 from the Poool Dashboard, Google Analytics and AT Internet.
The optimized conversion funnel framework
Poool data was collected based on an optimized conversion funnel framework, one that is adapted to the publishing industry and takes into account a user’s journey prior to the paywall. Instead of a single conversion rate metric, the report recommends breaking it down into 5 steps:
- Total visitors
- User visits premium content
- User sees the paywall
- User clicks on the paywall
- Users converts into a subscriber
This revised funnel has 2 key benefits:
- It takes into account the user journey prior to the paywall, understanding that a user’s decision to convert doesn’t just happen at the point of the paywall
- It allows you to pinpoint exactly where you’re losing traffic to make very targeted corrective action
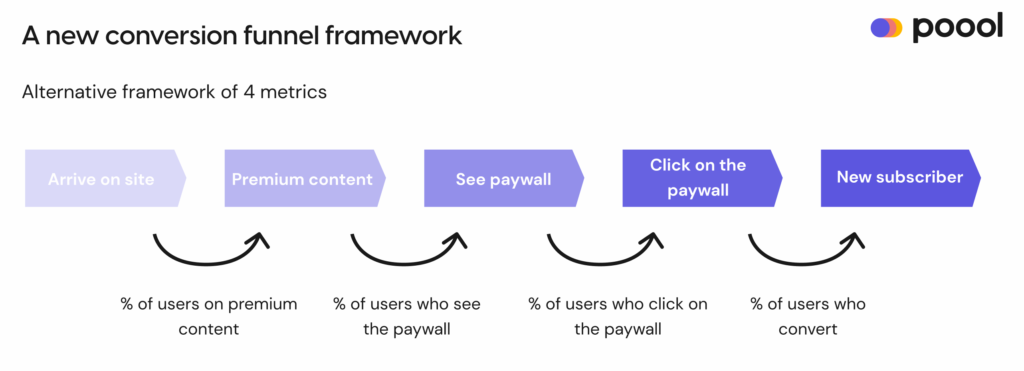
These 4 metrics form the basis of the benchmark report, with data being collected for each step.
The metrics included in this benchmark report:

1 - Percentage of users who visit premium content
2 - Percentage of users who see the paywall
3 - Percentage of users who click on the paywall
4 - Percentage of users who convert
1. Percentage of users who visit premium content
Definition of this metric
How many users on your website visit premium content, where they have the potential of being exposed to the paywall? Bear in mind that this metric doesn’t necessarily refer to the share of premium content you produce, but the amount of traffic that visits it. You might only have 2 premium articles out of the 100 that you produce in 1 month, but if they’re extremely well promoted then your share of traffic on premium content could be well over 2%.
Why is this metric important?
Whilst your free content (that isn’t blocked by a paywall) has the goal of increasing engagement and allowing users to discover your value, premium content should create a certain level of frustration in order to encourage a user to subscribe. Conversion, after all, is about finding a balance between frustration and engagement.
Benchmark results
The report splits this benchmark into two for an important reason. Specifically, a collection of publishers included in the study employ a hard paywall strategy, meaning all content is premium and so traffic on premium content is at 100%, skewing the averages. On the other hand, most publishers in the study employ a freemium strategy, meaning content is divided into free vs premium, and traffic on premium content is more dependent on the publisher’s optimization efforts.
Percentage of users on premium content, if we include these ‘Hard Paywall’ publishers:
Overall average: 66%
Range of results: 0.4% – 100%
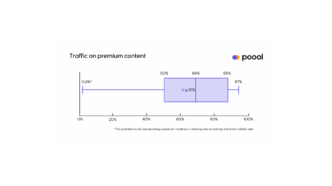
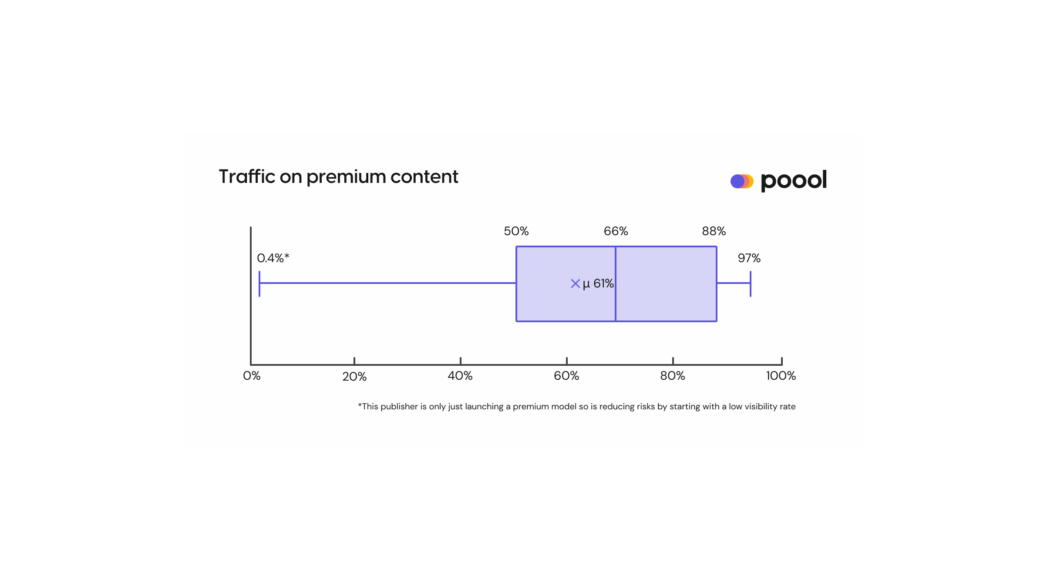
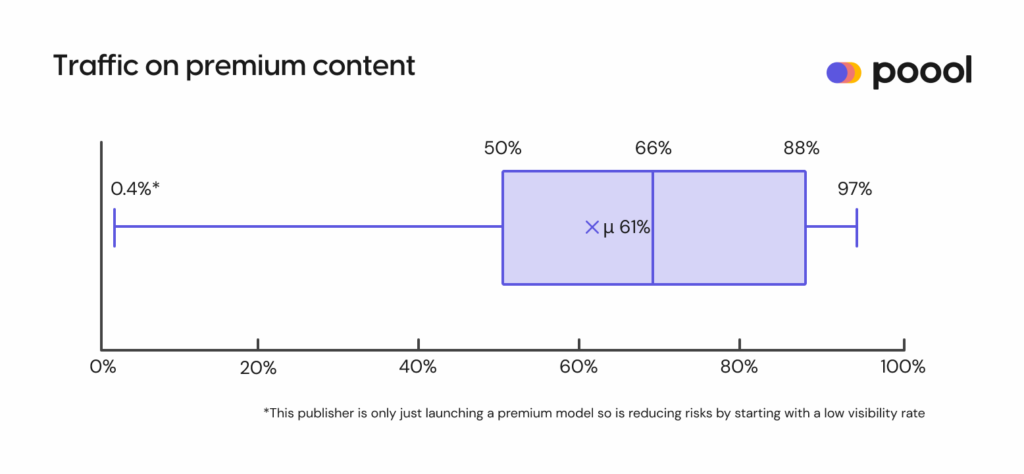
Percentage of users on premium content, if we only include publishers with a freemium model
Overall average: 61%
Range of results: 0.4% – 97%
Specialized media have the highest average visibility rate, closely followed by B2B and finance, all of which produce niche, focused content with a likely smaller but highly engaged audience who are more likely to subscribe. The result is that blocking more content with a paywall won’t have a negative impact on engagement but will instead cause the right amount of frustration to convert.
Equally unsurprising is our finding that news publishers had the greatest range of premium content visibility rate, from 15% up to 71%. This type of publisher is the most diverse when it comes to digital models. Many still offer paper subscriptions, others have never existed offline, and pretty much all are trying to find their balance between informing their audience on what’s going on in the world around them and monetizing their content. Having said this, when we compare results from our 2023 study to that of 2020, we can already see that news publishers are moving towards stricter premium models with increasingly more content being blocked by a paywall & premium content being placed higher on the homepage.
2019: 21.3%
2020: 37.2%
2023: 61%
This also applies to metered models. The New York Times, for instance, launched their paywall strategy back in 2011 offering 20 free articles per month. Today, it’s just one (and even that is blocked by a registration wall).
How can you optimize this metric?
You don’t necessarily need to produce more premium content, but simply increase its visibility:
- Promote premium content inside other articles for recirculation purposes
- Place more premium content in your newsletter, on social media, etc.
- Place premium content high up on the homepage
Case study: AOC
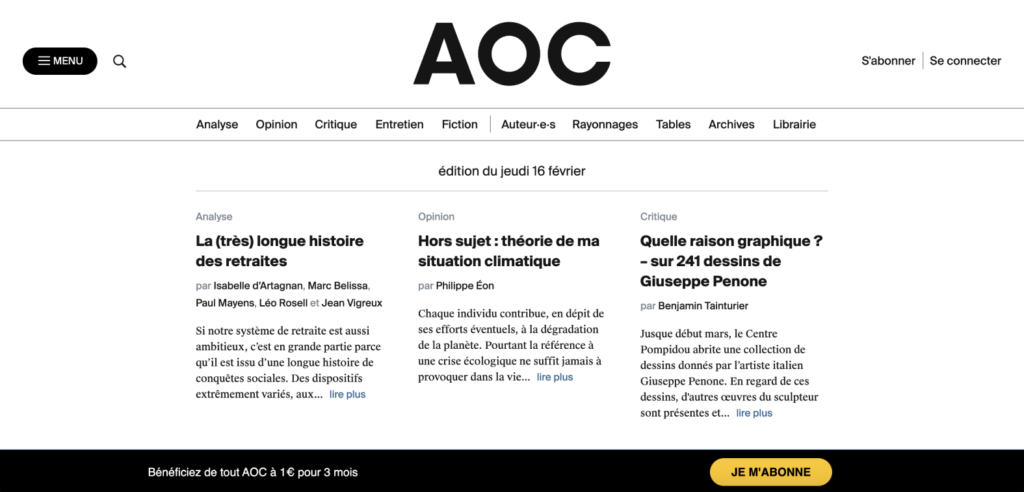
Goal: Increase premium offer visibility rate to ultimately have a positive impact on user-to-subscriber conversion rates
Strategy: The French publisher, AOC, standing for Analyse Opinion Critique (Analysis Opinion Review), recently added a banner to the bottom of their homepage and content to promote subscription and their special “5-year anniversary” offer
Results:
- Percentage of users exposed to the paywall increased by 64%
- Click-through rate increased by 329% in just the first 2 weeks of implementation
- Overall user-to-subscriber conversion rates increased by 3.5%
2. Percentage of users who see the paywall
Definition of this metric
This refers to the percentage of users on premium content who see the paywall.
Why is this important?
There’s often a significant loss of users between steps 1 and 2. Users visit a premium article but never actually see the paywall as it’s either too low on the page or too slow to load (because of too many ads or a heavy paywall script).
This step is valuable because, quite obviously, the visibility of your paywall will correlate with the number of users who convert via this paywall. After all, you can’t click-through a wall if you never see it.
Benchmark results
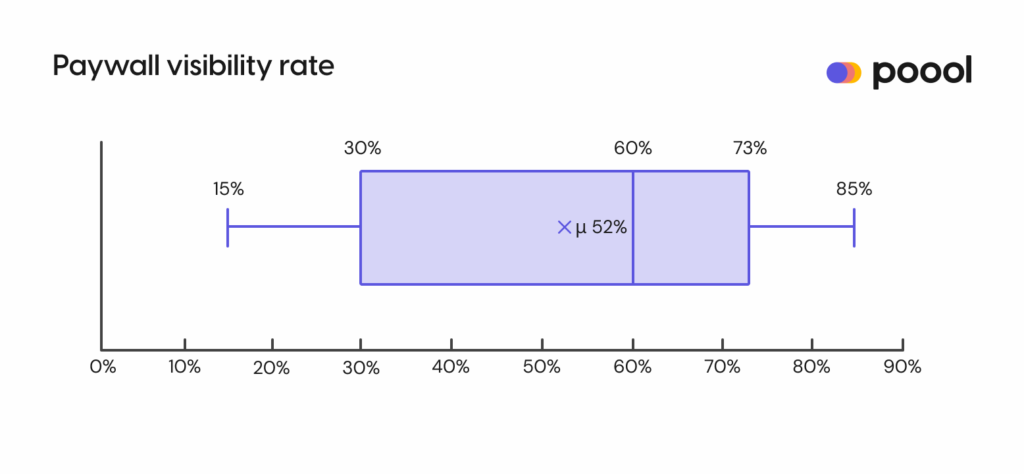
Overall average: 52%
Range of results: 15% – 85%
The first point to note is that these results align with our 2020 benchmark study that found an average of 30-60% paywall visibility rate. However, we’re also seeing more examples at the higher end of this scale as publishers become increasingly mature in their digital subscription strategies, blocking readers earlier on in the article. American and British publishers, for instance, who are arguably the most mature in their paywall models, are blocking >80% of content, with many examples of those at 100%, such as The Washington Post & Financial Times.
As expected, specialized media are again at the top of the range with the highest visibility rate. Lifestyle publishers and daily regional press also lie in the higher end of this metric, but note that data for daily regional press ranges from 39% all the way up to 85%, suggesting that brands differ significantly based on their context (e.g. size of audience, level of engagement, etc. which vary significantly across regional press).
Download the full report
To discover Poool’s benchmarks for the next two steps in the funnel – click-through rate and paywall conversion rate – as well as discover optimization techniques for each metric, download the full report for free by filling out the form below: